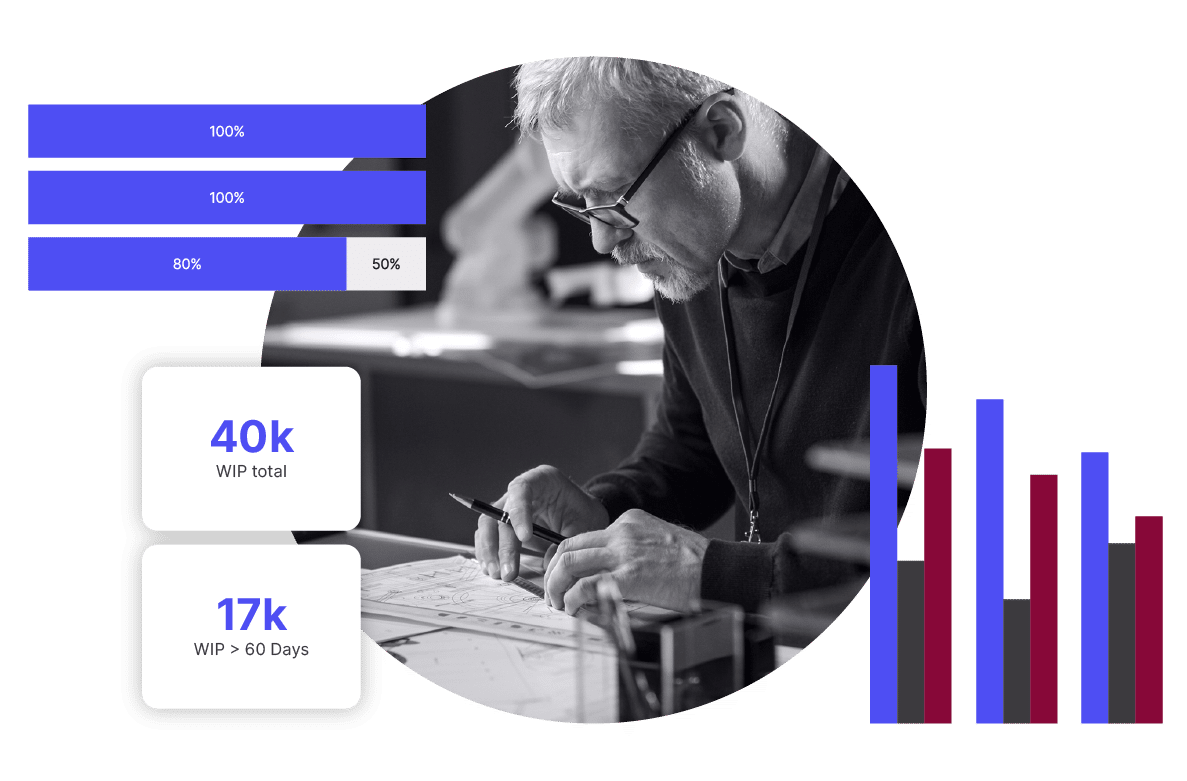
Make Confident Decisions with Clear, Reliable Project Data.
Your data holds the key to better decisions. Total Synergy’s reporting and dashboards help A&E businesses spot trends, identify what’s working, and make informed changes. No guesswork needed.
See the full picture with dashboards for every corner of your practice—business, projects, people, sales, finances, and forecasting. Total Synergy’s analytics make it easy to connect the dots between your data and your decisions
Dashboards That Tell Your Business’s Story
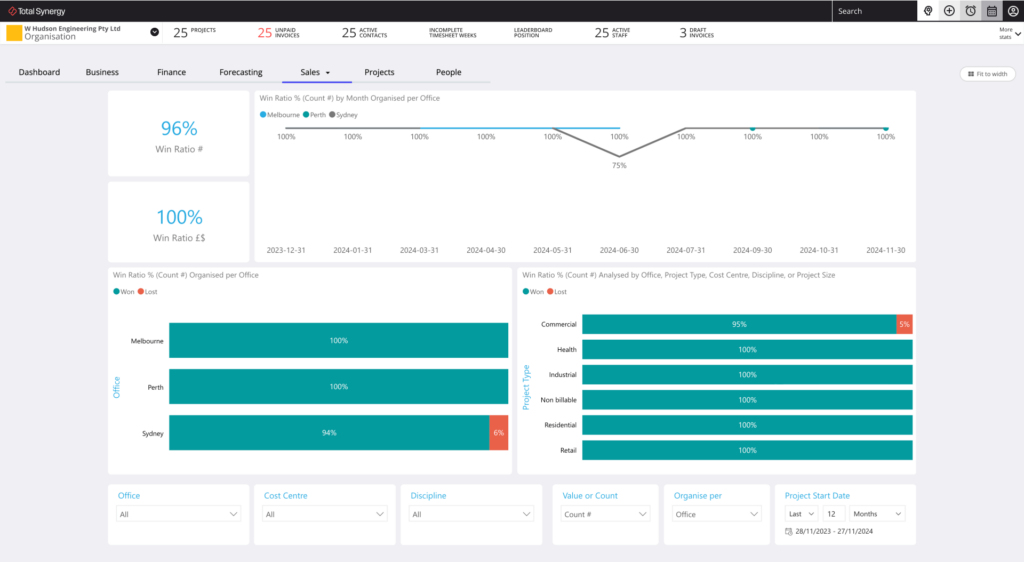
Sales Dashboards That Close the Gaps
Understand what’s working (and what’s not). See your proposal pipeline at a glance. View your proposal pipeline, analyse win/loss rates, and spot gaps in your sales process to strengthen your practice’s bottom line.
Book a Demo
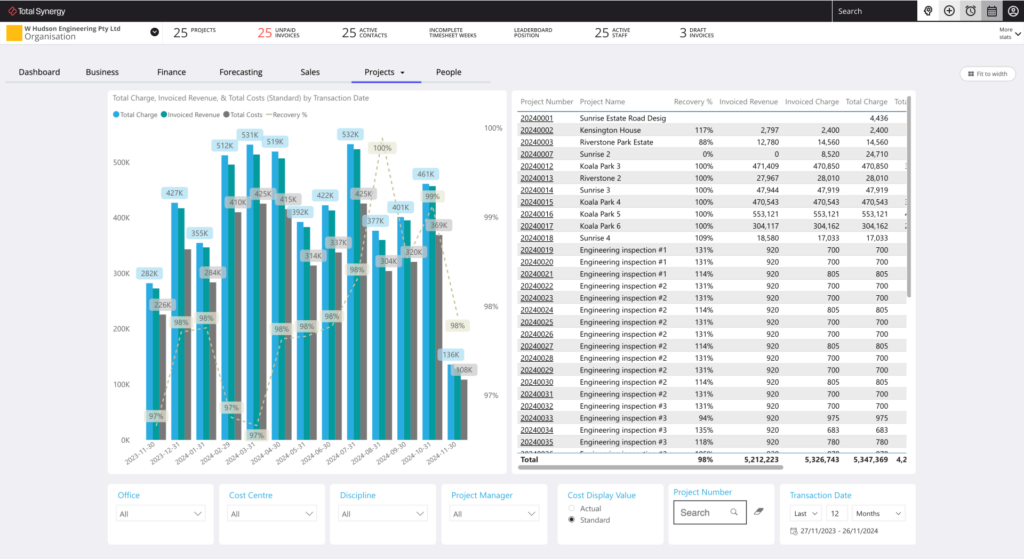
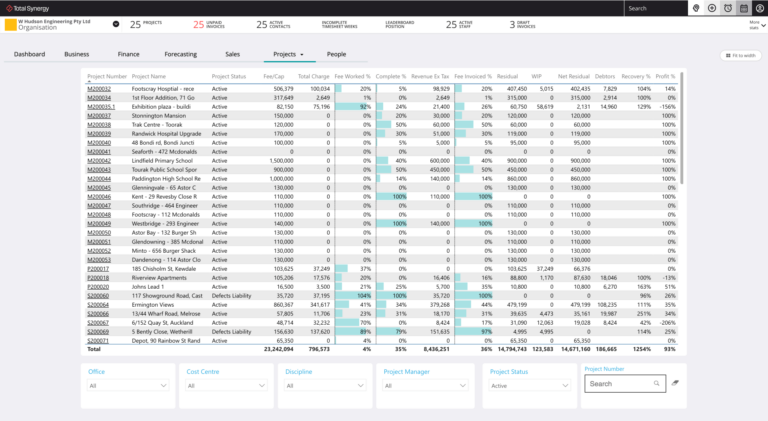
Project Dashboards That Keep You on Track
Gain complete visibility with Total Synergy’s project dashboards. From stage-level financials to forecasting future resource needs, these dashboards give you complete visibility into your project portfolio. With clear, actionable insights, you’ll always stay ahead of the curve.
Book a Demo
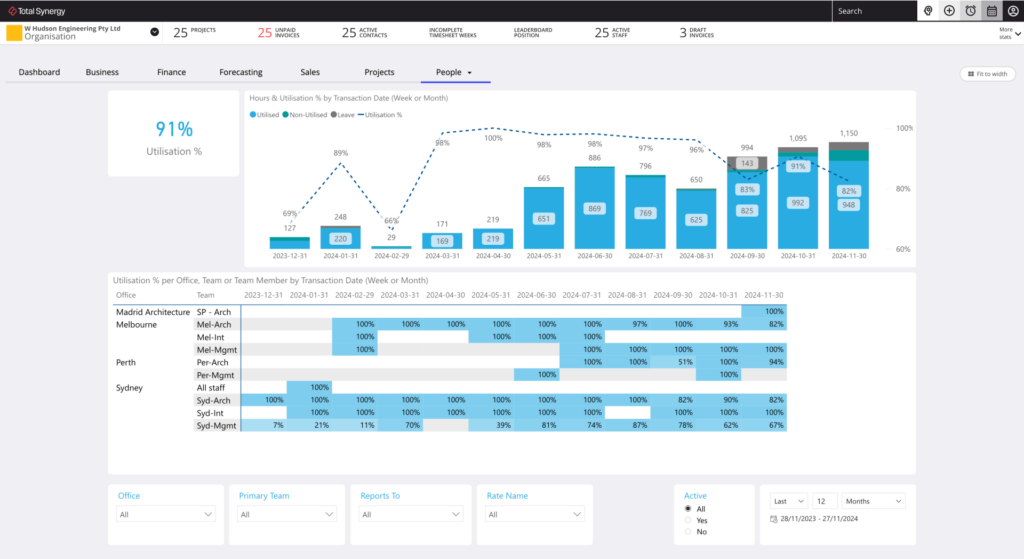
People Dashboards That Maximise Your Team
Your people are your greatest resource, and our people dashboard helps you manage them properly. See how your team’s time is being used, identify areas of underutilisation, and balance workloads to keep everyone performing at their best.
Book a Demo
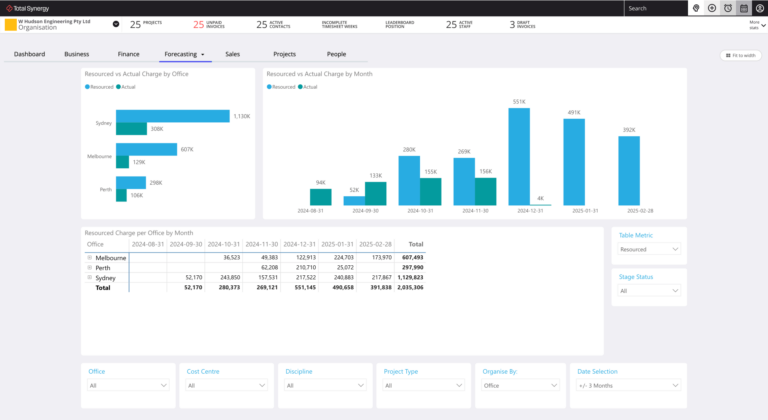
Forecasting Dashboards That Keep You Ready for What’s Next
Our forecasting dashboards break down project timelines, compare planned vs. actual resources, and predict invoiced revenue. Spot gaps in your pipeline, balance your team’s workload, and make smarter decisions to keep projects on track.
Book a Demo
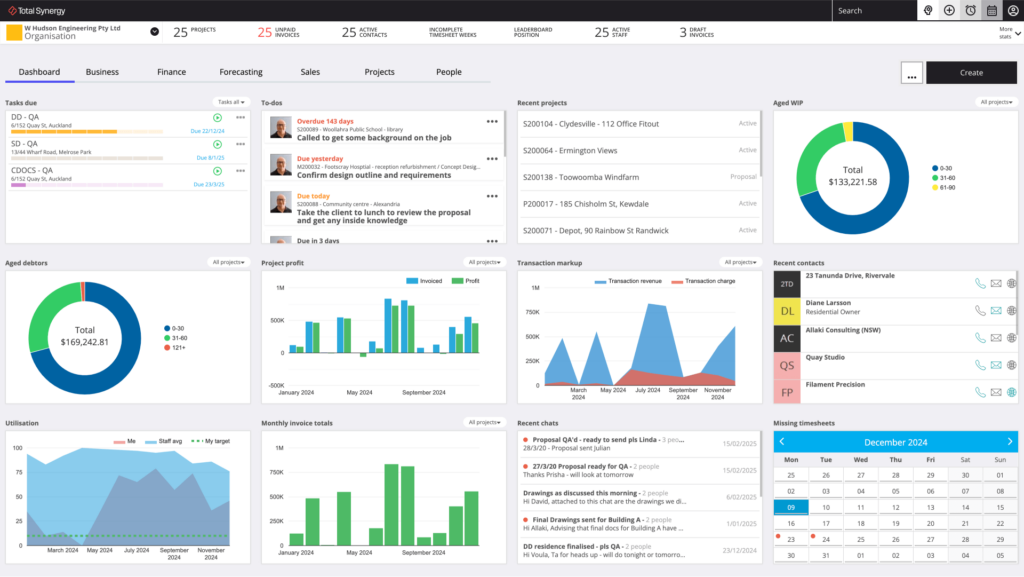
Business Dashboards That Show the Big Picture
See how your practice is really performing. Monitor WIP recovery, profitability, and revenue trends to see what’s working and make growth-driving decisions. Whether it’s a single project or your whole firm, you’ll have the insights to make decisions that drive growth.
Book a Demo
Finance Dashboards That Simplify Your Cash Flow
Take control of your cash flow with Total Synergy’s finance dashboards. Track WIP, write-offs, and debtors to spot issues early and stay on top of payments and revenue without the headaches.
Book a Demo
18,000 A&E Professionals Trust Total Synergy
Don’t have time for a demo? Fill out the form to get a 15-minute video demo sent to your inbox.
Connect Without Disruption. Seamlessly Integrate with the Tools You Use Every Day
Our experienced team is here to guide you through how Total Synergy can transform your project management approach.
Take the first step toward transforming your practice. In just one demo, our team will show you how Total Synergy simplifies project management, project finances, and project analytics for over 18,000 A&E professionals.
Julian
Conor
Aaron
John
Oliver
Let’s Get Started with Your Personalised Demo
Get the Clearest Path to Project Success with Total Synergy
From project management to financial clarity, explore the tools and insights that empower A&E firms to operate seamlessly and profitably.
Insights and Strategies for Optimizing Your A&E Projects
Discover articles and expert tips on enhancing project management, resource allocation, and financial oversight.
Read Our Blog
Exceptional Support for Seamless Project Management
Find out how our support team ensures your firm leverages Synergy to its fullest potential, from onboarding to ongoing assistance.
Get 24/7 Support
Solutions Built for the Unique Needs of A&E Firms
Explore how Synergy’s tools are tailored to meet the specific requirements of architecture and engineering practices.
For Architects
For Engineers
Why Total Synergy?
Simplify Product Delivery
Free Your Team to Focus On What They Do Best: Delivering Great Projects
Reduce Project Risk
Reduce Project Risk with Real-Time Financial Insights.
Win the Right Projects
Win Projects That Drive Profit and Avoid the Ones That Don’t.
Receive 24/7 Support
Expert A&E-Focused Support Whenever You Need It.
Solutions
Produce Budgets & Quotes
Make budgeting and quoting easier, more accurate, and less stressful.
Manage Projects
Stay organized, on time, and on budget with tools that drive project profitability and efficiency.
Track Time
Track time effortlessly, stay on budget, and improve billing accuracy at every project phase.
Allocate Resources
Easily see who’s working on what, their availability, and how to best balance workloads.
Process Invoices
Get invoices out faster, reduce delays, and keep cash flowing with clear project finances.
Track Finances
Make budgeting and quoting easier, more accurate, and less stressful.
Decide with Data
Make smarter decisions with real-time dashboards and reports.
Forecast Revenue
Gain crystal-clear visibility into your future revenue, project profitability, and resource needs.
Apply Document Control
Centralize your project information for seamless collaboration, better control, and fewer headaches.
Use Cases
By Practice
Architecture
Deliver Your Best Designs with Project Management Built for Architects
Engineering
Manage Engineering Projects with Precision and Clarity
By Role
Business Owner
Run a Smarter Practice with Less Stress
Finance Leader
Take Charge of Your Firm’s Financial Future with Confidence