
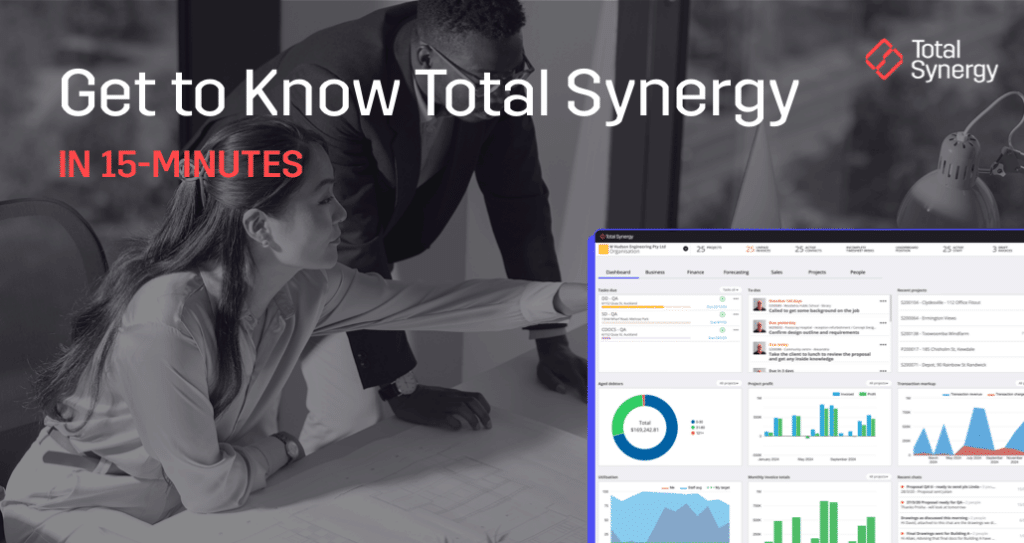
See the full picture with dashboards for every corner of your practice—business, projects, people, sales, finances, and forecasting. Total Synergy’s analytics make it easy to connect the dots between your data and your decisions
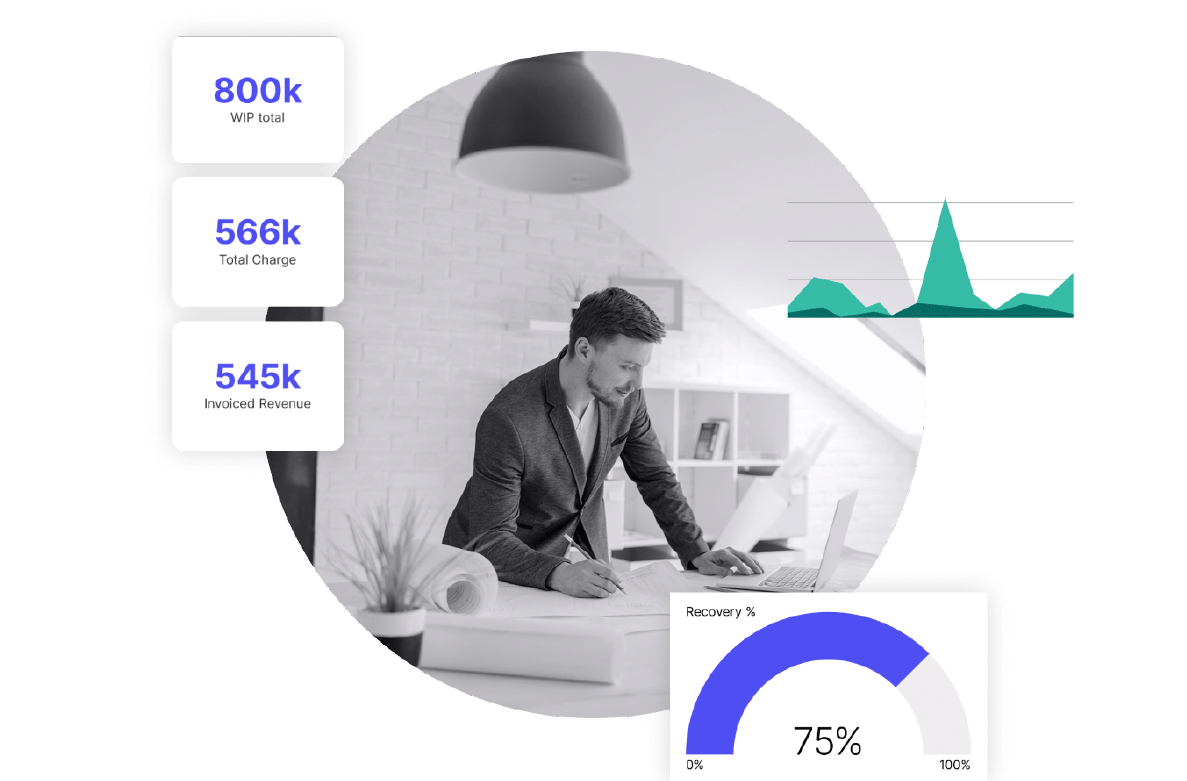
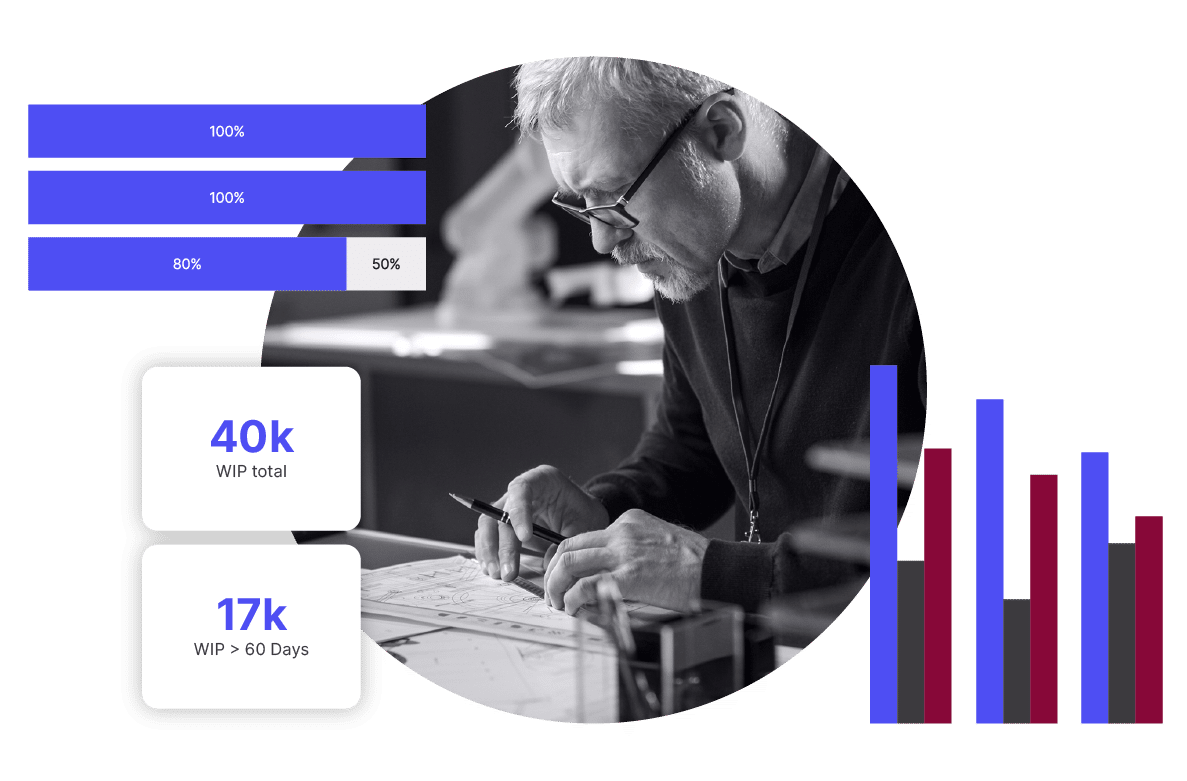
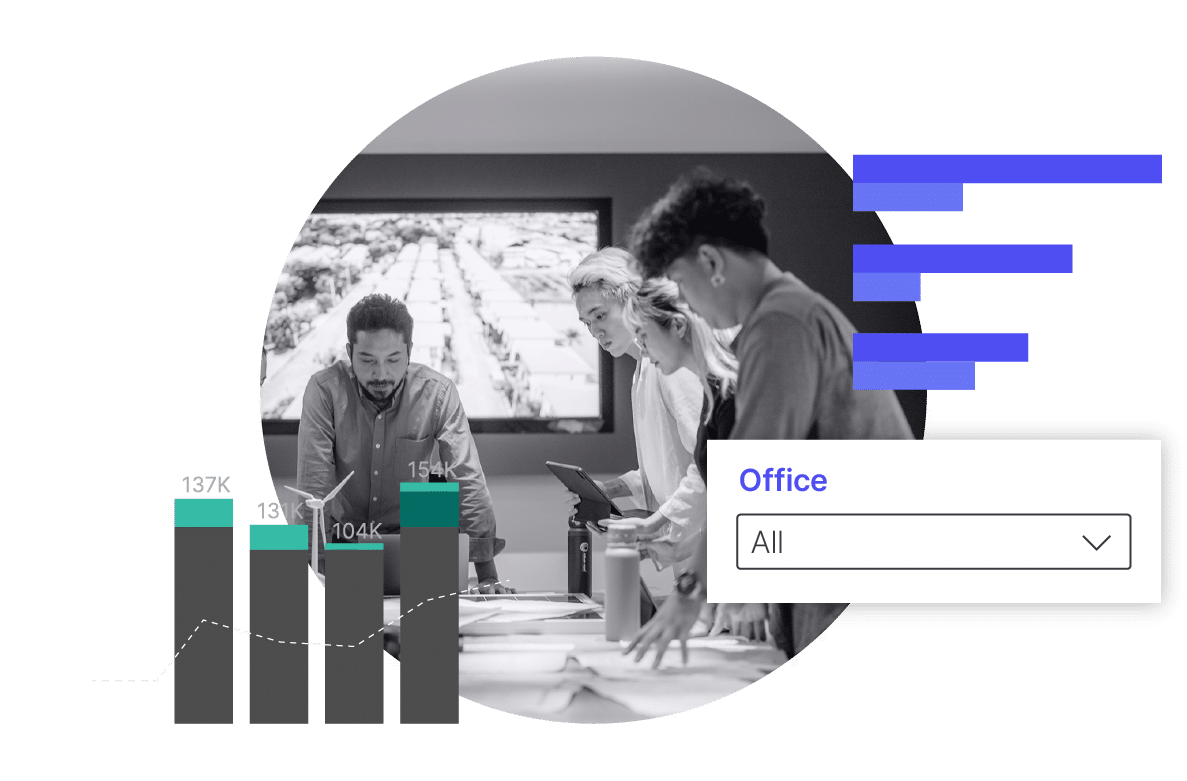
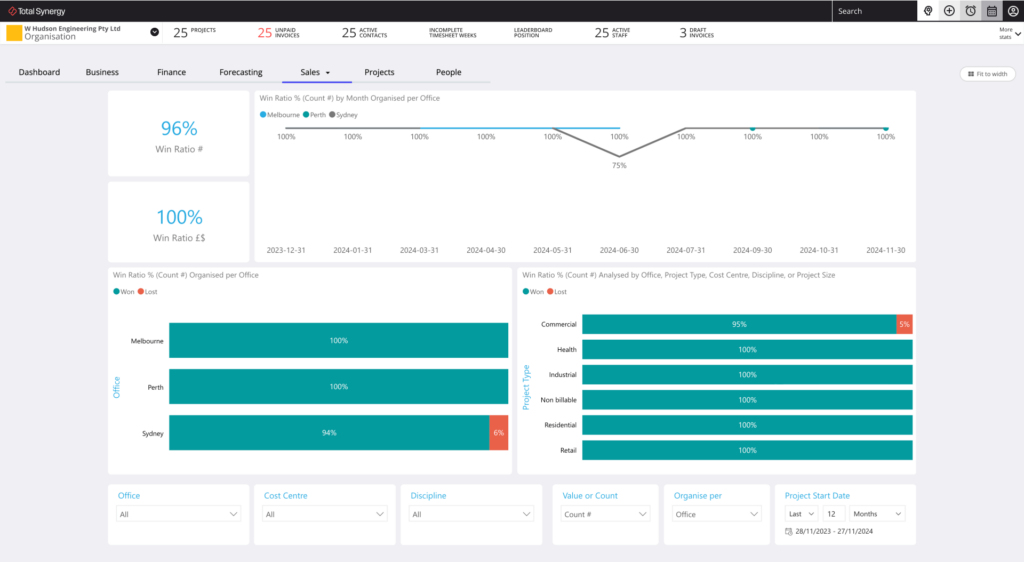
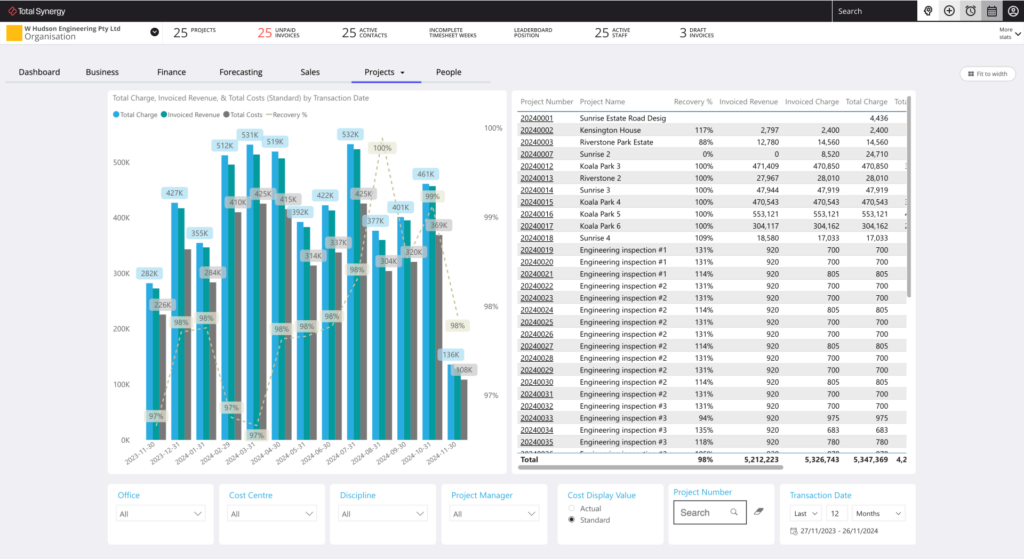
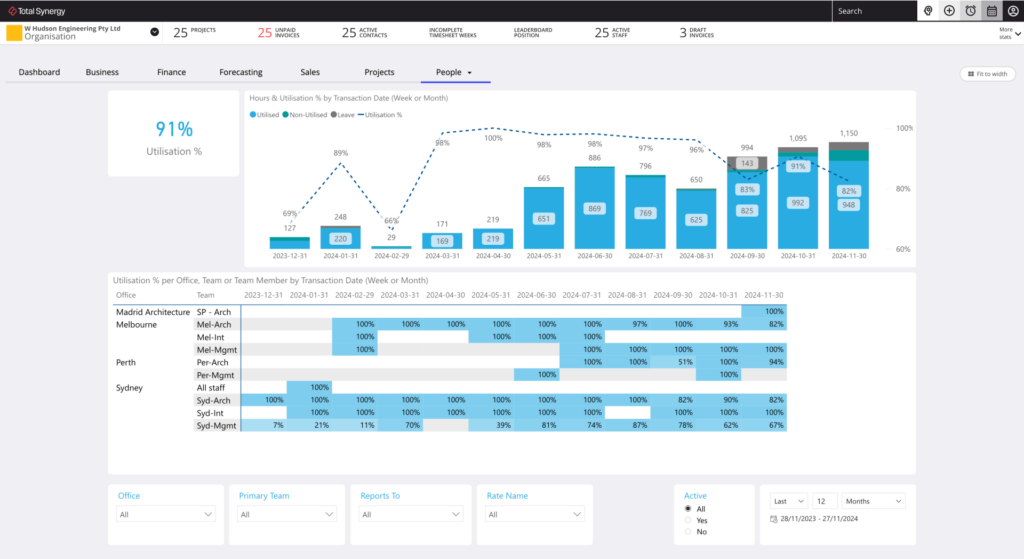
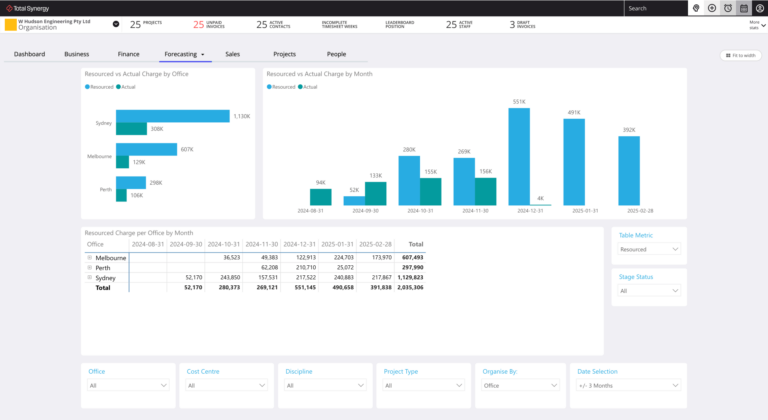
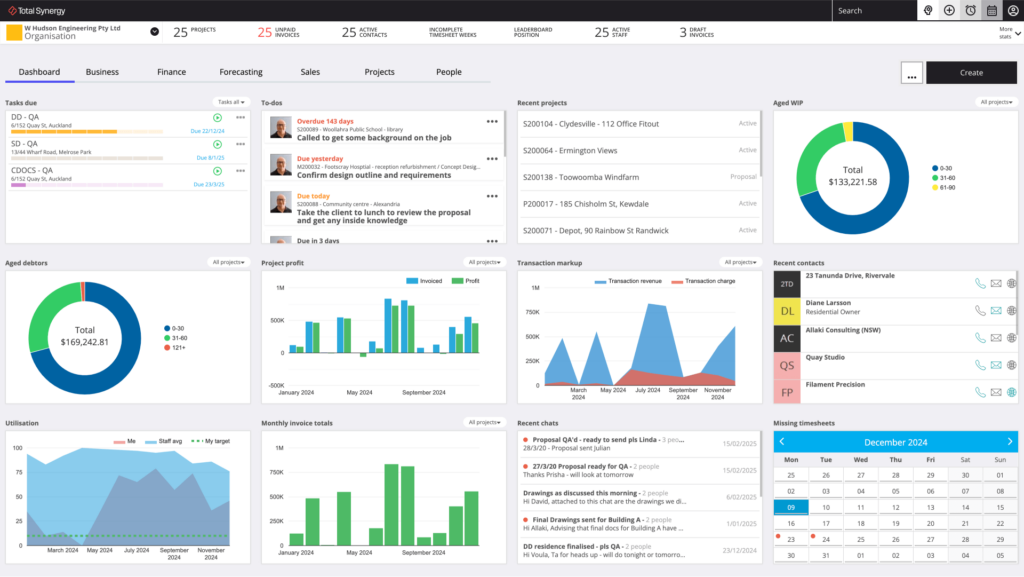
See how your practice is really performing. Monitor WIP recovery, profitability, and revenue trends to see what’s working and make growth-driving decisions. Whether it’s a single project or your whole firm, you’ll have the insights to make decisions that drive growth.
Don’t have time for a demo? Fill out the form to get a 15-minute video demo sent to your inbox.


Discover additional features that expand Total Synergy’s capabilities for architecture and engineering firms.
Analytics Plus
Advanced dashboards and reports, helping you make data-driven decisions.
Learn More
Premium API
Seamless integrations with your existing tools using a powerful API.
Learn More
Synergy PIM
Centralized management for all your project documents and emails.
Learn More
Synergy HR
Simplified staff management for availability, skills, and leave tracking.
Learn More
Synergy CRM
Organized tracking for client interactions, leads, and opportunities.
Learn More
Double invoicing capacity
Time saved on invoicing
Saved on projects per week
Global A&E users
Our experienced team is here to guide you through how Total Synergy can transform your project management approach.
Take the first step toward transforming your practice. In just one demo, our team will show you how Total Synergy simplifies project management, project finances, and project analytics for over 18,000 A&E professionals.

Julian

Leonard

Conor

Aaron

Kalo

Justin

John
From project management to financial clarity, explore the tools and insights that empower A&E firms to operate seamlessly and profitably.
Insights and Strategies for Optimizing Your A&E Projects
Discover articles and expert tips on enhancing project management, resource allocation, and financial oversight.
Read Our Blog
Exceptional Support for Seamless Project Management
Find out how our support team ensures your firm leverages Synergy to its fullest potential, from onboarding to ongoing assistance.
Get 24/7 Support
Solutions Built for the Unique Needs of A&E Firms
Explore how Synergy’s tools are tailored to meet the specific requirements of architecture and engineering practices.
For Architects
For Engineers
Simplify Product Delivery
Reduce Project Risk
Win the Right Projects
Receive 24/7 Support
Produce Budgets & Quotes
Make budgeting and quoting easier, more accurate, and less stressful.
Manage Projects
Track Time
Track time effortlessly, stay on budget, and improve billing accuracy at every project phase.
Allocate Resources
Easily see who’s working on what, their availability, and how to best balance workloads.
Process Invoices
Get invoices out faster, reduce delays, and keep cash flowing with clear project finances.
Track Finances
Make budgeting and quoting easier, more accurate, and less stressful.
Decide with Data
Make smarter decisions with real-time dashboards and reports.
Forecast Revenue
Gain crystal-clear visibility into your future revenue, project profitability, and resource needs.
Apply Document Control
Centralize your project information for seamless collaboration, better control, and fewer headaches.