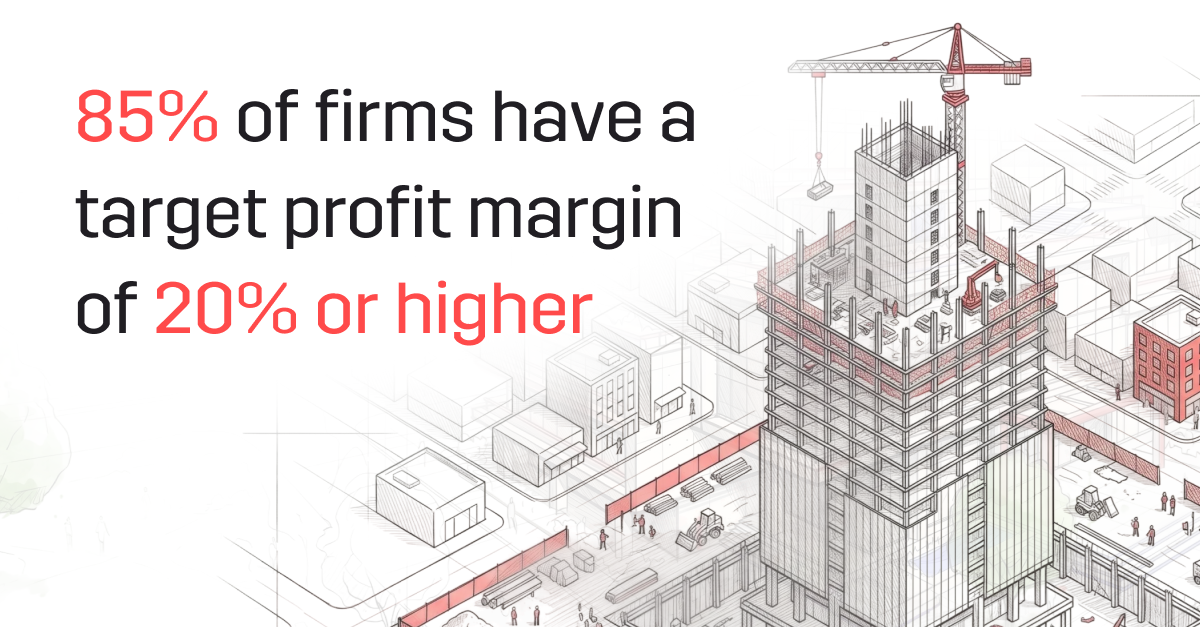
According to the 2026 Architecture Industry Benchmark Report, 85% of architecture firms have a target profit margin of 20% or higher. Most aren’t hitting it. That gap points to a set of recurring problems that, despite being common, are imperfectly managed across the sector.
In 2026, 60% of firms report a net profit margin of 15% or below after all expenses. These numbers leave limited buffer for scope overruns, fee write-offs, or delayed payment cycles; all issues which can impact cash flow and profitability.
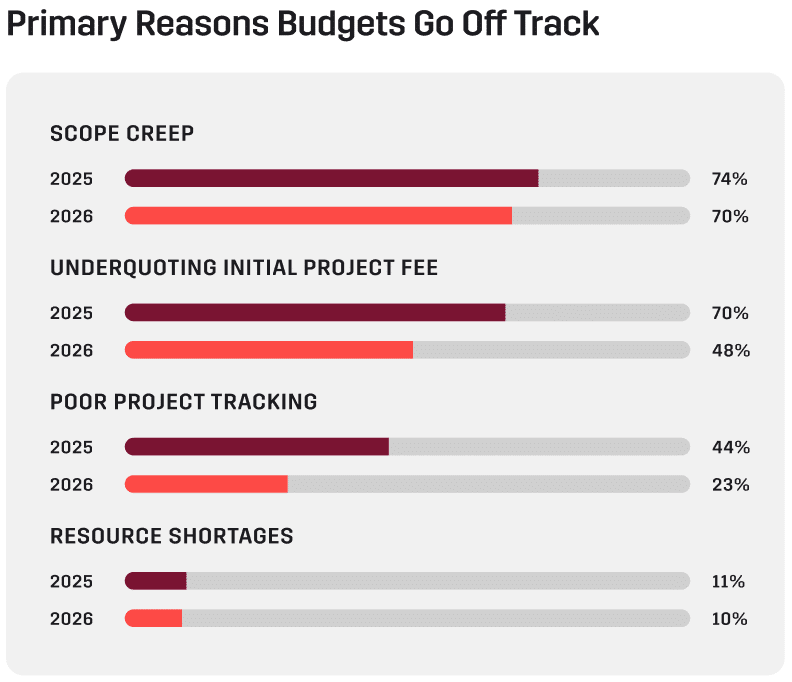
Scope Creep is Still Winning
When asked what the most common cause of project overrun is, 70% of respondents pointed to scope creep. That figure has held steady from 2025, which is a telling finding. Despite improvements in project management tools and tracking practices, the single biggest driver of budget overruns remains largely unaddressed.
The good news is that budget control is improving. In 2026, 22% of firms report fewer than 10% of their projects exceeding initial budget, up from just 4% in 2025. But more than 40% of practices still see at least a quarter of their projects overrun, and for those firms, the cost accumulates project by project.
The firms that manage scope creep the best tend to catch budget issues early on. Real-time financial tracking gives project managers the visibility to act when a project is trending over budget, not after the damage is done.
Realisation Rate Remains Architecture’s Biggest Blind Spot
One of the most overlooked metrics in architecture is realisation rate: the proportion of billed time actually collected from clients. In 2026, 42% of firms said they do not track it at all, and a further 7% are unsure whether they do. That means nearly half the sector has no visibility into one of its most direct measures of financial performance.
Among firms that do track it, the numbers are not reassuring. Only 7% report a realisation rate above 90%. 15% are collecting below 70 cents for every dollar of billed time. Without this insight, it is difficult to know whether pricing strategies are working, where revenue is leaking, or how efficient the invoicing and collections process truly is.
Payment timelines are also lengthening. In 2026, 56% of firms wait more than 30 days from invoicing to payment, up from 48% in 2025. Against a backdrop of shorter pipelines and tighter margins, delayed collections add further pressure to practices that are already stretched.
How Does Your Firm Compare?
The 2026 Architecture Industry Benchmark Report draws on responses from architecture practices across the globe to give the sector a clear picture of how firms are operating right now, covering opportunities and challenges spanning everything from profitability, staffing, technology and growth.
For more insights, and to discover how your margins, utilisation and business development efforts compare to firms like yours, download the report here to see the full picture.
About Total Synergy (Australia)
Total Synergy is an Australian software company based in North Sydney, NSW, helping architecture and engineering practices across Australia improve project visibility, resourcing, and profitability with project management and practice management software. Try Total Synergy for free today and discover how the platform can transform your firm.