
Architecture practices generate enormous amounts of data. Client history, project finances, team capacity, pipeline, utilisation. Most practice leaders know the data is there. The harder question is getting to it before it becomes outdated.
In many firms, leaders are still relying on hindsight reporting, disconnected spreadsheets, or informal updates to piece together how the business is actually performing.
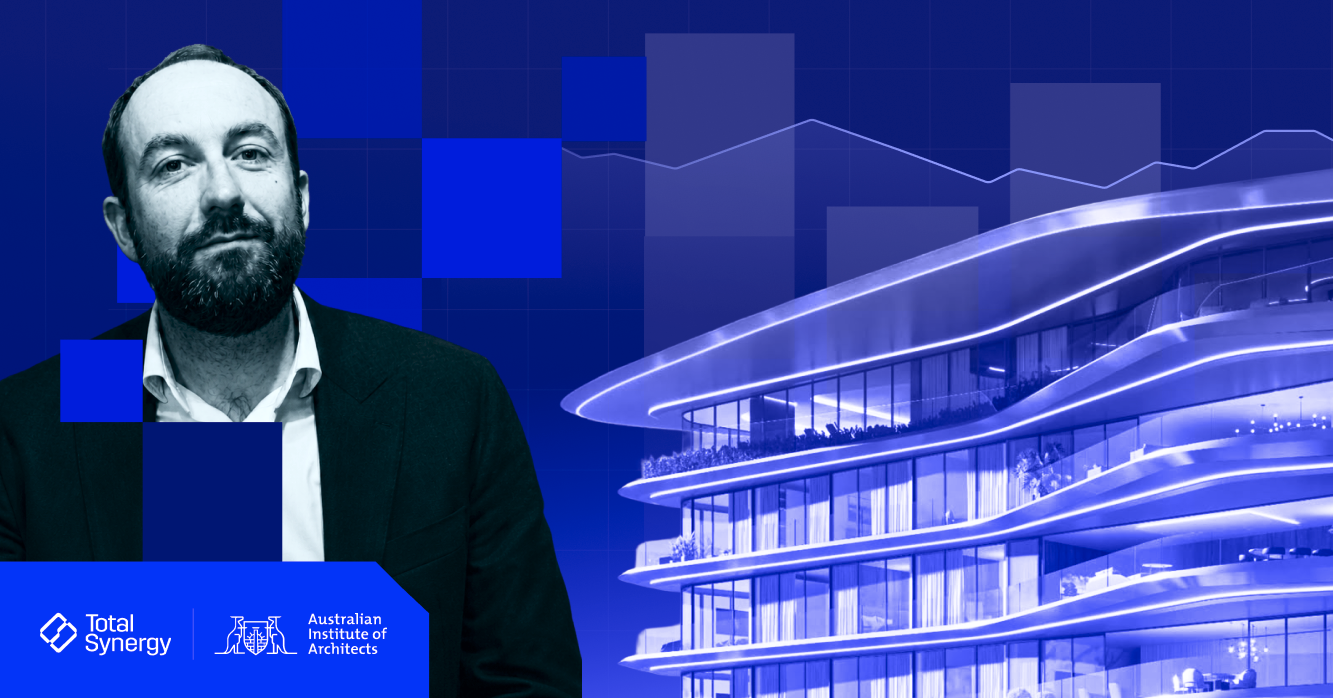
Jonny Gray, VP of Professional Services and Analytics at Total Synergy, sees this pattern constantly.
“We find practices often using lagging numbers and looking backwards. There’s often a real lag in the information becoming available to the people that need it. More often than not, they’ve got a big Excel workbook that somebody in Finance or Operations is turning the handle on every month.” – Jonny Gray
The result is slow, costly, and easy to get wrong. Duplication creeps in, key numbers arrive too late, and by the time a problem is visible, it’s already had weeks to compound.
That gap between having data and using it is where most practices lose time, margin, and momentum.
The Metrics That Matter
You don’t need 50 KPIs. Architecture firms often have plenty of data. The challenge is simplifying it down to what leadership really needs to see.
“Creatives aren’t necessarily there to manage a bunch of numbers, albeit it’s a really important part of your job. So how can we make that as simple as possible by showing you the stuff you really need to see and removing some of the noise?” – Jonny Gray
The firms getting this right focus on a handful of indicators: fee exhaustion against completion, scope creep through budget variance, profitability by project and client, and resourcing coverage against pipeline. The goal isn’t to track everything. It’s to surface early where a conversation needs to happen.
But access alone isn’t enough. Even when data is technically available, it needs to be filtered and presented in a useful format, whether that’s a quick operational view for staff or a deeper financial cut for leadership. Handing someone raw data with thousands of rows just puts the burden back on them, and most project leads don’t have the time to work through it.
Why Visibility Changes How People Work
Good data doesn’t just report on your practice. It runs it.
Firms with solid planning, clean data, and forward-looking processes are met with fewer surprises on projects and profitability. Additionally, having up-to-date data makes resourcing, capacity and financial planning significantly easier.
“The quality of the conversation you can have is so much better. And you can take actions now that were going to impact things in six to nine months. No more surprises, no more post-mortems over what didn’t work.” – Jonny Gray
Insights Pro is built to drive that visibility. With 52 configurable dashboards covering projects, people, finance, and pipeline, practice leaders can move from monthly spreadsheet scrambles to live decisions made with confidence, at every level of the firm.
About Total Synergy
Built in Australia, Total Synergy is a global software platform purpose-built for the architecture and engineering industry. It’s all-in-one solution brings together project management, resourcing, budgeting, time tracking, document management, invoicing, and reporting into a single system.
Trusted by thousands of A&E professionals across the globe and with teams in Sydney and London offering around-the-clock support, Total Synergy simplifies complex workflows so teams can spend less time on admin and more time delivering exceptional results.
Try Total Synergy for free today and discover how the platform can transform your firm.