Every architecture and engineering firm depends on data, but not every report delivers the same kind of value. The reports in Total Synergy are built to make data feel approachable and genuinely useful. They help firms see progress clearly, make confident decisions, and focus on what drives better project outcomes.
Of all the reports available, three stand out as clear customer favourites for the value they deliver every day.
The 3 Reports Driving Better Decisions Every Day
1. Project Profitability Report
Profitability is one of the clearest signs of a healthy project. It’s also the report most firms can’t live without.
Project Managers use it to keep tabs on how their projects are performing, while directors use it to see the full financial picture. Each role gets the level of detail they need, from charge-out rates to actual costs, so everyone can see what’s working and what needs attention.
It’s simple, smart visibility that helps firms make better calls about pricing, performance, and progress, all without revealing sensitive staff information.
2. Budget vs. Actuals Report
If there’s one report that keeps projects running smoothly, it’s Budget vs. Actuals.
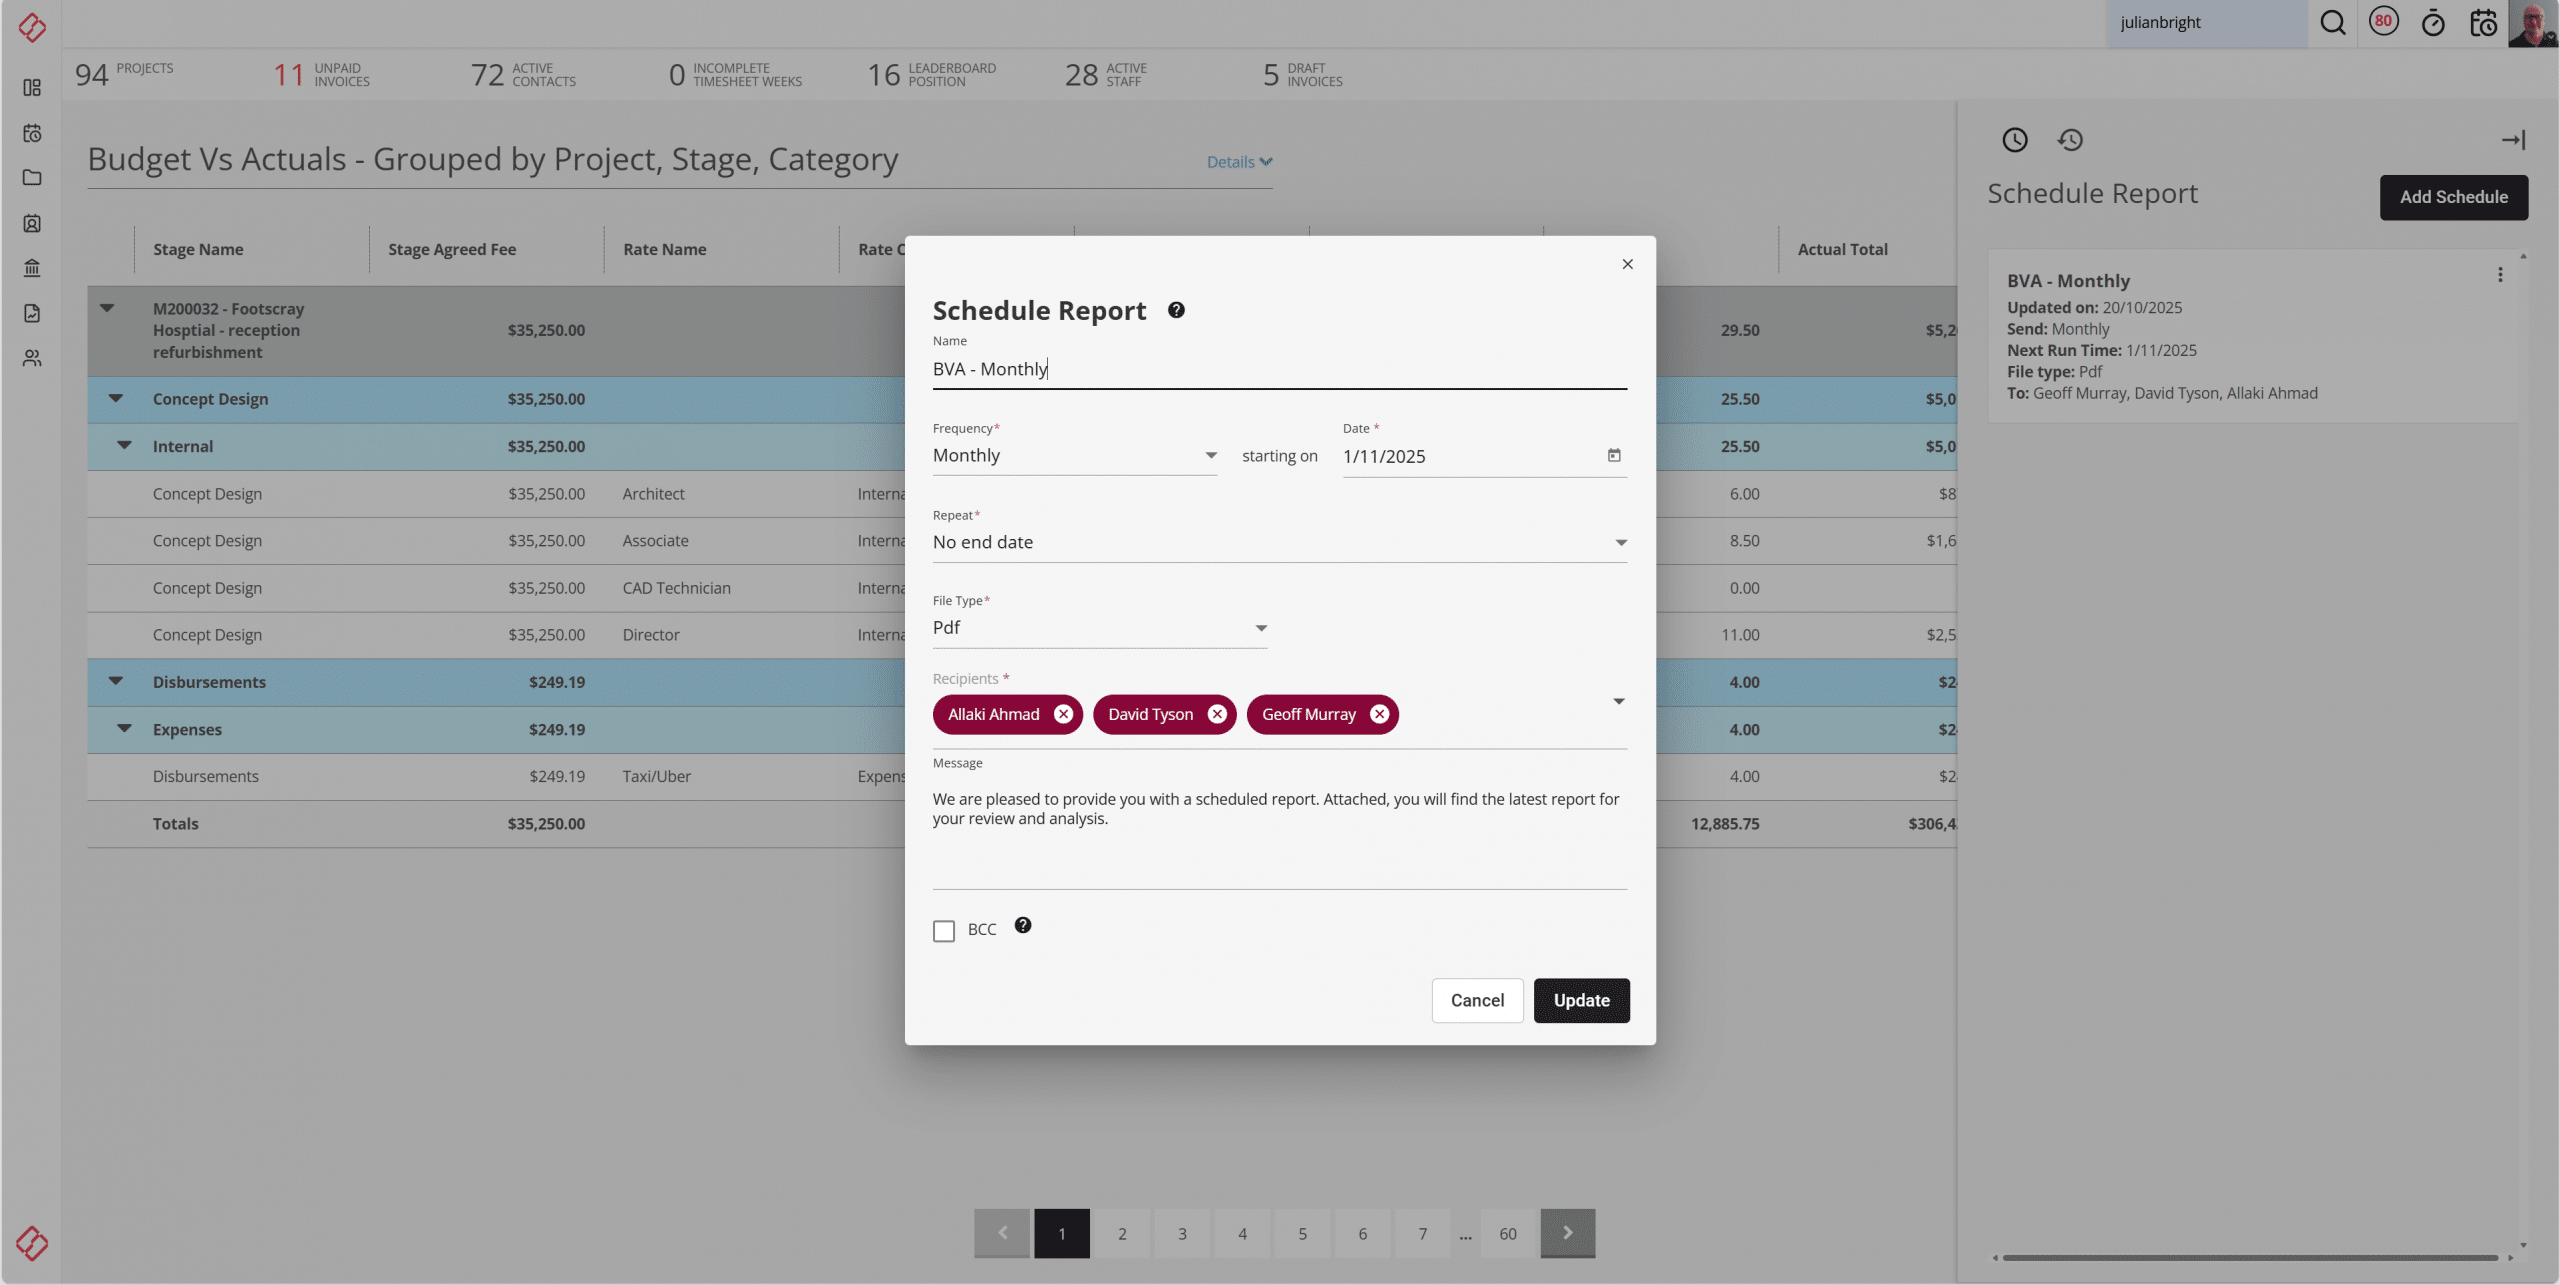
It shows how much time, expense, and financial effort has gone into a project compared to what was planned, so you can instantly see whether you’re tracking on budget. You can filter it by discipline, office, or project manager to see how each part of your business is performing.
Firms love this report because it’s grounded in reality. It gives everyone a clear view of progress and helps teams make adjustments before small issues turn into bigger ones.
3. Utilisation Report
The Utilisation Report is where people and performance meet.
It shows how your team is spending their time and whether workloads are balanced. You can view utilisation weekly, monthly, or quarterly to see who’s busy, who’s over capacity, and who could take on more work.
This is the report that helps firms stay efficient without burning people out. It turns time data into actionable insight and helps leaders keep their teams working at a sustainable pace.
Features That Make Reporting Even Better
Of course, great reports are only as useful as how easy they are to access and share.
That’s where Total Synergy’s reporting features shine
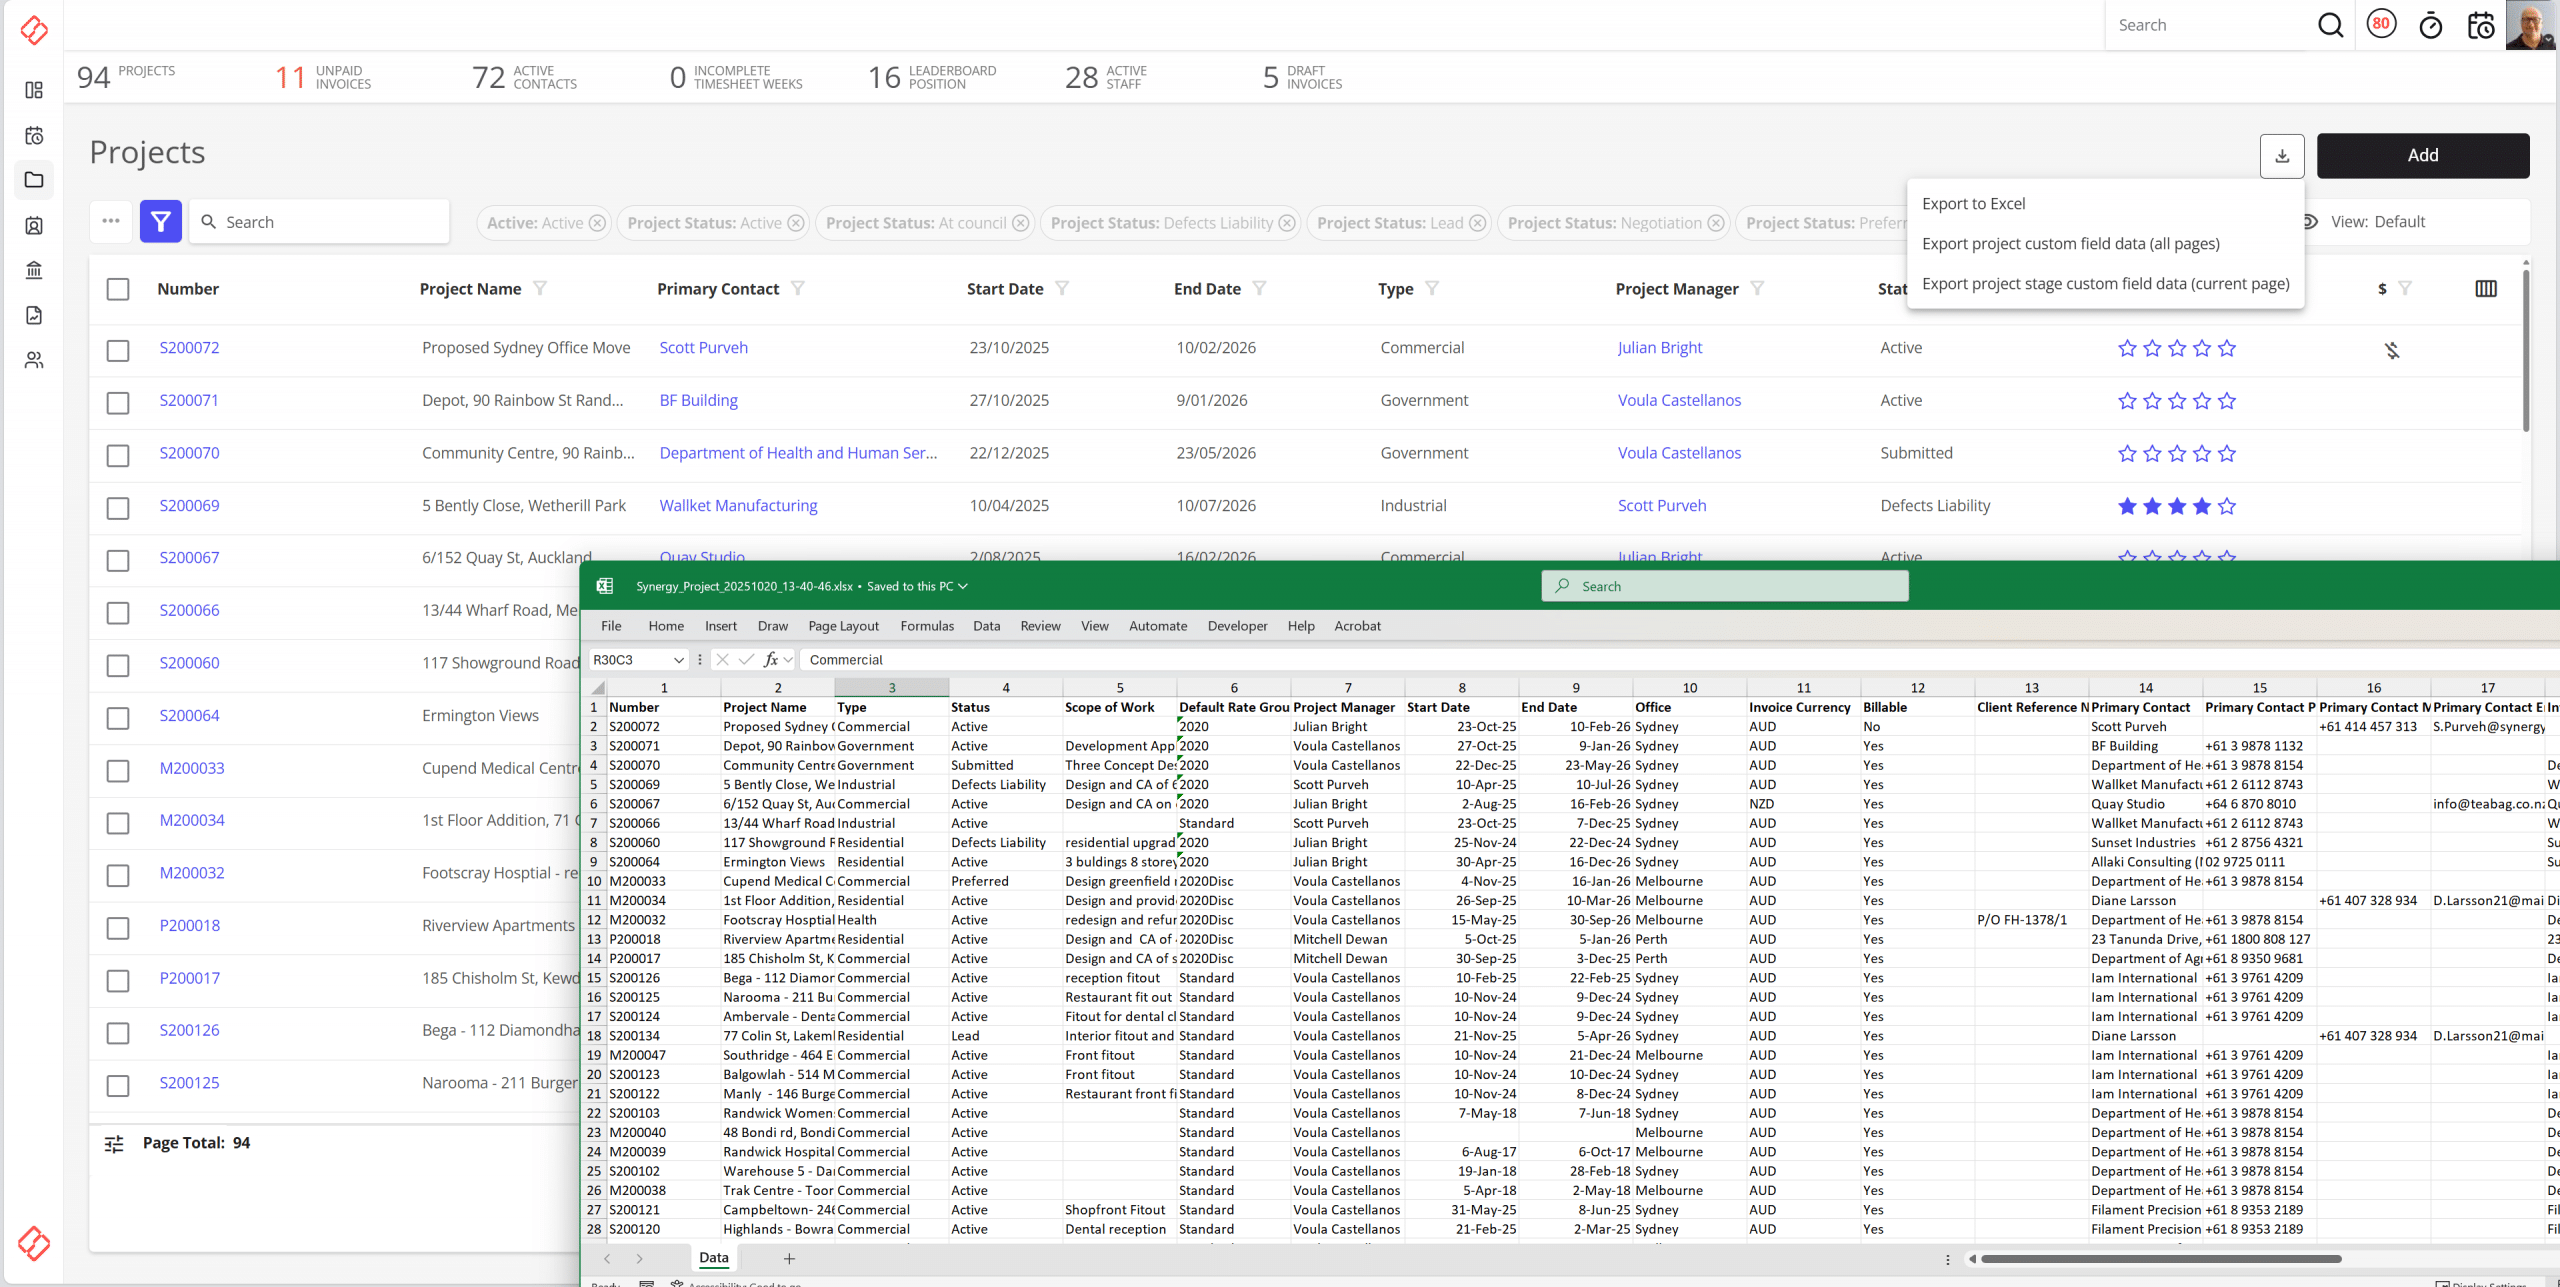
Export to Excel
Export data from projects, invoices, staff, and transactions in one click. Your filters come with you, making it simple to dig deeper or share insights.
Scheduled Reports
Send reports automatically to the people who need them. Whether it’s a weekly WIP summary for project managers or a monthly overview for directors, scheduled reports keep everyone in the loop.
Analytics+ Dashboards
For those who love visuals, Analytics+ integrates with Power BI to turn your data into dynamic charts and dashboards. It’s an easy way to see performance trends at a glance.
Custom Expressions and Fields
Make reports your own with custom KPIs, calculations, and data fields. Whether you’re tracking profitability per discipline or staff utilisation by office, you can build the metrics that matter most to your firm.